There comes a time in one’s life when one must figure out what is luck and what is skill in curling. And what the hammer team controls and what the non-hammer team controls. These things are really the essence of sports analysis and if one wishes to do insightful curling analysis, they will have to check these boxes.
This post is an effort to begin down that road, and if you’re into graphs, I have a lot of them. To facilitate the analysis, I’ll be grouping data by event strength.
I’ve alluded to idea of event strength previously but will describe it more formally here. The concept is simple: Take the average strength of all teams participating in an event (based on the doubletakeout.com ratings) and round it to the nearest integer. Here’s a rough description of what each level means.
12: Grand slams plus top-level Canadian events like Canada Cup and Roar of the Rings. This includes most events that are open to the best curlers in the world regardless of country.
11: The Olympics and World Championships. Better events on the cashspiel circuit in both Canada and Europe. This also includes higher-end national championships and some of the better provincial championships.
10: I force the 100th-best team in my ranking to have a rating of exactly 10, so that provides a frame of reference. Lesser national and provincial championships are on this level. Some provincial tour events as well. Junior Worlds fall into this category.
9: A lot of lower-level cashspiels and a few junior events make the cut. Some tour events in Asia and Europe are in this group. Various provincial qualifiers and assorted “minor” national championships ship up here.
8: Most provincial junior tour events as well as lower-level provincial playdowns end up here. There are still some lower-level national championships, as well. USA junior championships are in here, also.
7: Provincial junior tour events, mainly in the U18 and U15 categories, fall in here. Amazingly, there are a few provincial playdown events that end up here as well. Some national junior championships are in this level.
6: Mainly U15 events and some random bonspiels that show up on CurlingZone.
I don’t really rate anything below 6, but the beauty of this system is that lower levels exist in theory. In my mind, the person throwing their first rock at a learn-to-curl is probably a zero. A league curler having played for a couple years and taking it kind of seriously might be a 5. I didn’t design the ratings scale to work that way, but it’s a neat coincidence I’m going to assume is true. 🎵No curler is below a zero at doubletakeout.comTM🎵
With the levels established, we have a framework to see how the game changes across abilities.
For the following discussion I am looking at only the first four ends of games in order to minimize the effects of playing the scoreboard. As always, scores from prior seasons are from our friends at CurlingZone. Well, I’m only imaginary friends with them for now, but maybe someday. All graphs are using data from the last four seasons. Now onto the fun.
As teams get better, the team with last rock…
…is able to score when it needs to score.
We discussed this a couple of weeks ago, but in a sudden-death situation the team with last rock is more likely to score as event strength increases.
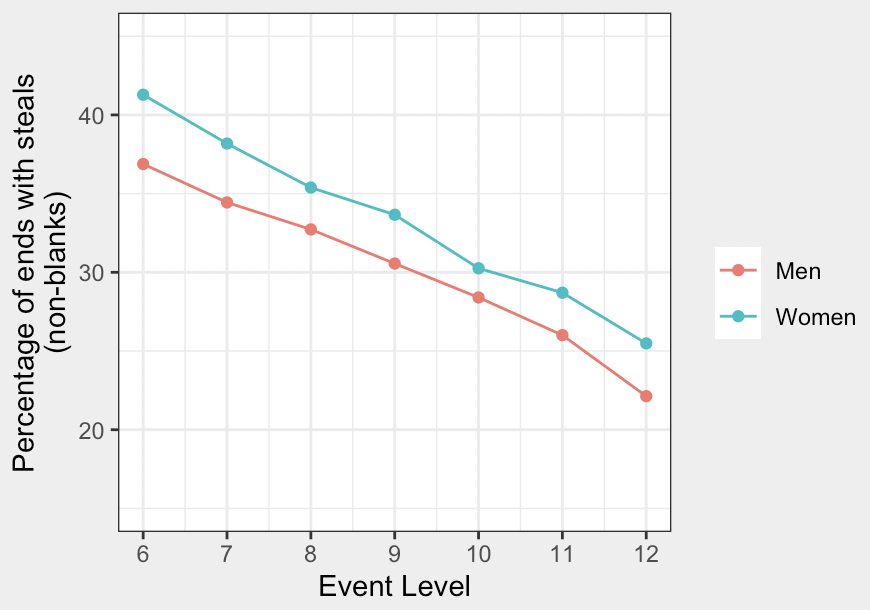
…is less likely to give up a steal.
At the elite level, only about one in four non-blanked ends are stolen. At lower levels of the competitive spectrum, more than one in three are stolen.
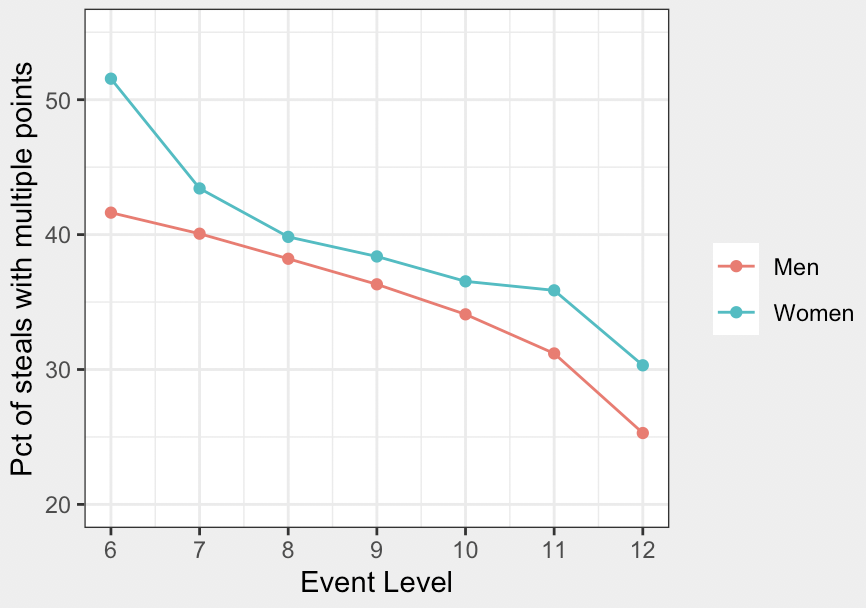
…and even less likely to give up a multiple-point steal.
Only about one in four steals are two points or more in elite events. Combined with the overall steal rate shown above, only about one-in-20 non-blanked ends feature a multiple-point steal in elite men’s games.
…is more likely to get forced.
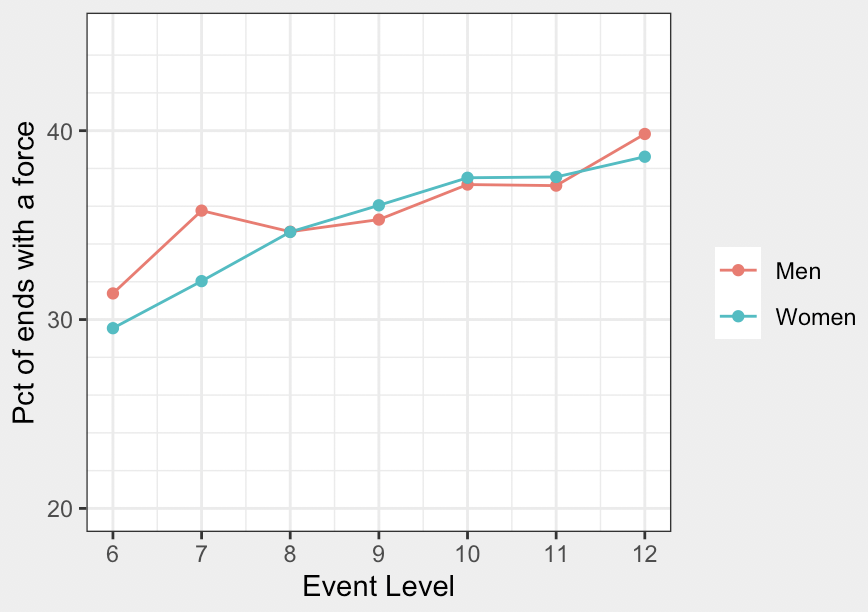
However, this is not really what it appears to be. The hammer team is generally trading steals for forces as it moves up the skill ladder. Here is how forces look as a percentage of cases when the hammer team scores.
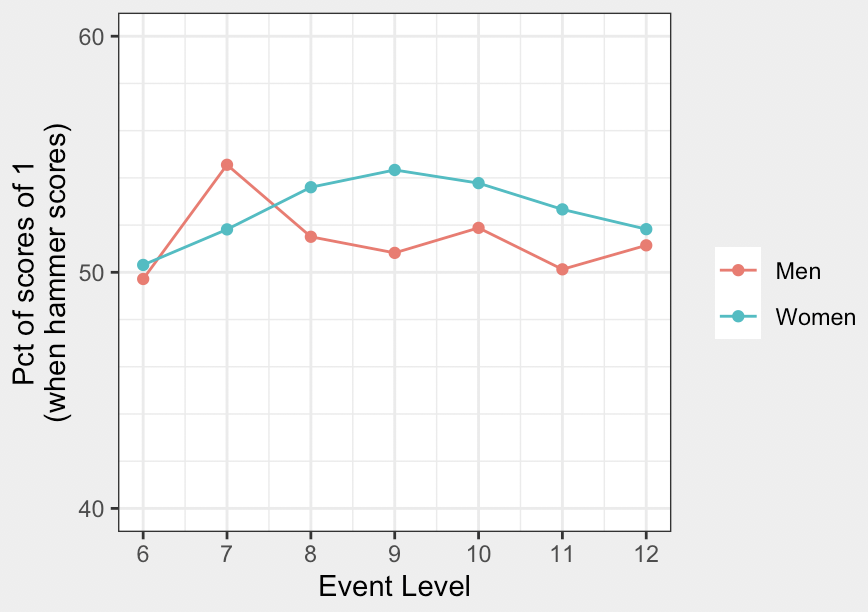
There’s not much of a trend here. Across skill levels, when hammer scores, it’s about 50/50 that it will be for one point.
…is more likely to play for a blank
Well, sort of. There’s clearly a rise in blanks, especially on the women’s side, as teams advance through the lower levels of competitive curling, but across the top 100 teams, there isn’t much difference at all.
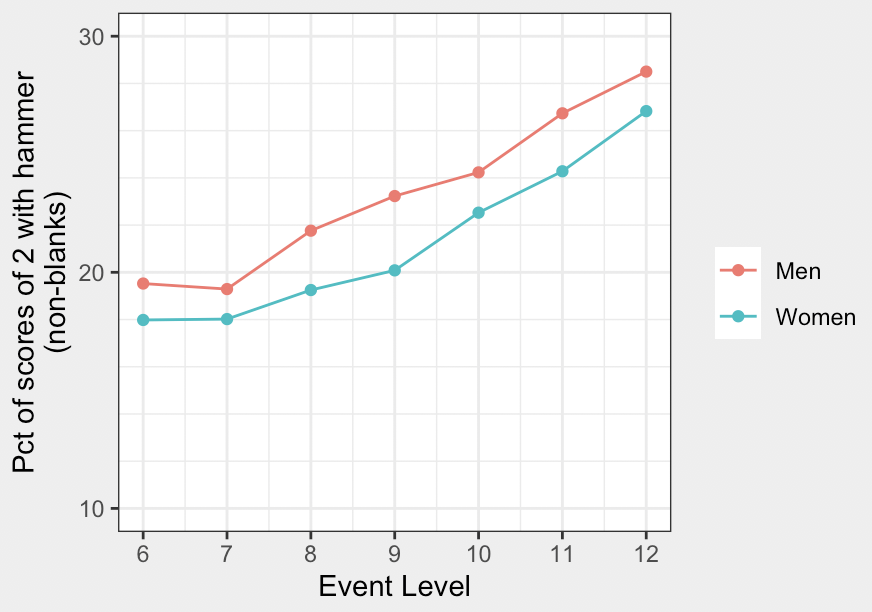
…is more likely to score two.
Some of those blanks at the elite level turn into steals at lower levels, making the deuce a less likely scenario as skill decreases. The ability to score two with last rock is the foundation of the elite curling squad.
Even as a percentage of cases where hammer scores, better teams score 2 more often.
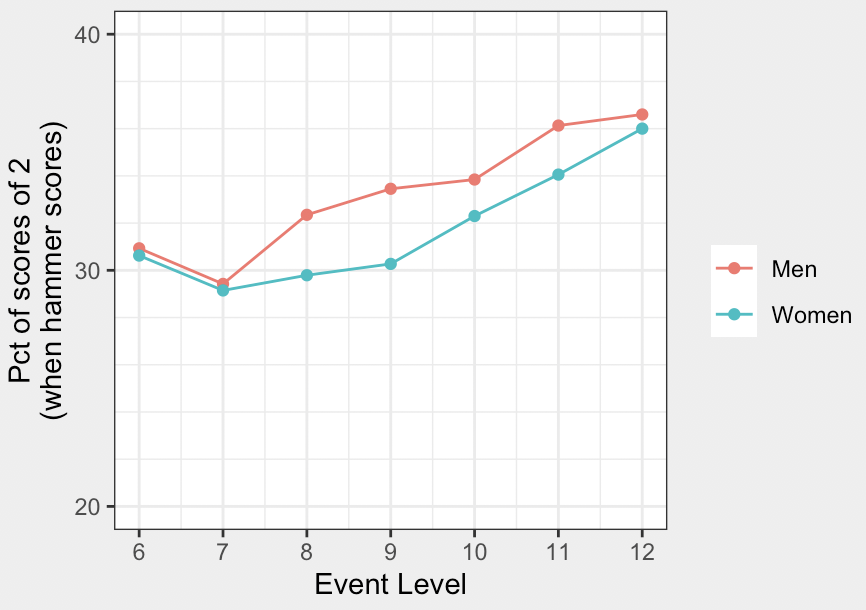
Although, that’s partly because hammer is…
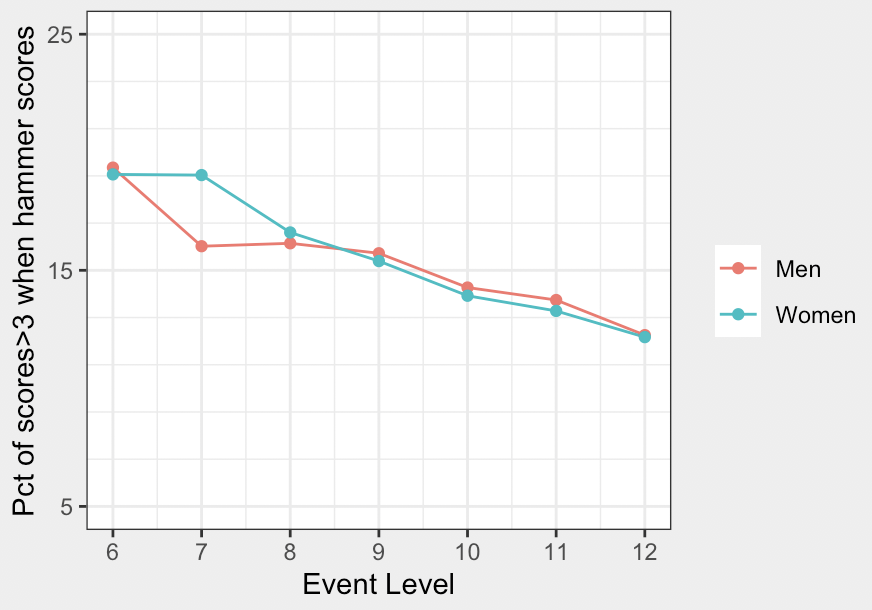
…less likely to score more than two.
Scoring three or more requires skilled shotmaking from the hammer team but it also requires some blunders from the opponent. And as we get into events with better teams that cooperation doesn’t exist as often.
On balance, the hammer team does more things well as the skill level of teams increase. It follows that the value of hammer increases as skill level increases. Here’s the average net points per end (non-blanks) for hammer in the first four ends:
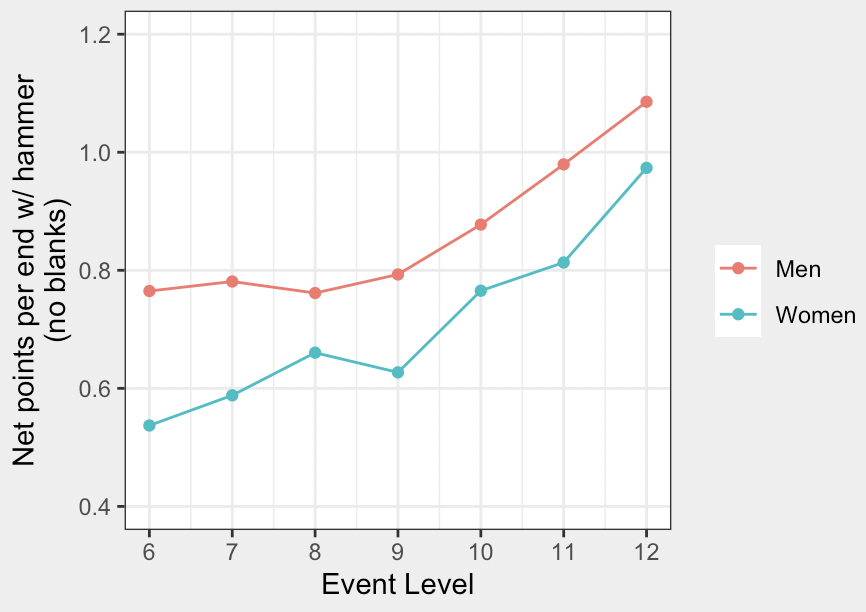
While it increasingly seems like there’s little difference between the best teams in the world and robot curlers we have a long ways to go before the best team is good enough to score 2 with hammer every time. If we extrapolate the data from the graph into higher event levels, we wouldn’t get to a hammer value of 2.0 until approximately level 21 at the men’s level and level 22 at the women’s level.
None of the preceding should surprise people that have been around the game their whole lives. (It it largely consistent with conclusions drawn from different methodology used in a paper by Palmer, Geurts, and Gunnlaugson.) As players get better there are fewer mistakes made and when they do make mistakes, they have more shots in their arsenal to recover. That leads to a game where, as the skill level increases, the power of the hammer to probe for a deuce becomes the dominant game mode, with forces and blanks being the common alternative. (As opposed to a typical funspiel where big numbers get posted on the scoreboard regularly.)
The slopes of the lines on these plots tell you whether hammer or non-hammer is in control of a particular aspect of an end. For instance, where values increase by skill towards a desirable outcome for hammer, hammer has more control and where they decrease towards a desirable outcome for hammer, non-hammer has more control.
Hammer has more control of scoring in sudden-death, scoring a deuce, avoiding steals, and especially avoiding steals of multiple points.
Blanking and forcing are in some murky middle ground where hammer and non-hammer have roughly equal responsibility for these outcomes.
Non-hammer has more responsibility when hammer scores more than 2.
These concepts have ramifications for how to evaluate teams. For instance, when hammer scores 3 or more, a greater share of the credit (in a negative sense) should go to the non-hammer team for allowing it rather than the hammer team for scoring it.
And following from that, I suspect you’d find less season-to-season correlation in a team’s ability to score 3 than their ability to score 2, even accounting for the relative rarity of the former.
The bottom line is if you want to be successful at the highest level you better be good at scoring 2 with hammer and avoiding steals. While the non-hammer team can affect those things, the ability to do those two things (or not do them) consistently is more in the control of the team with hammer.