Every sport has some form of a box score which provides a summary of a game’s statistics. Curling doesn’t exactly have a box score, but for the big events, the foundational data is there. The shot data recorded by scorers is subject to some personal judgment, but even so, it’s actually a decent starting point to interpret what has happened in the game.
For the uninitiated, each shot is scored on a scale of 0 to 4, with points awarded based on whether the intent of the called shot was achieved. That’s a fine start, but shooting percentages are as much about a player’s ability as they are about the difficulty of the shot called, especially for stones thrown later in the end. If your third is asked to throw runback doubles and precise hit-and-rolls all game, they’ll have a worse percentage than the player that gets to throw guards and open take-outs.
Fortunately, the raw data provides enough information to get us started on accounting for the difficulty of each shot. Each shot is given a task, and just by averaging the points awarded for each task at each shot during an end, you can get a reasonable estimate for the difficulty of each shot.
For instance, in the men’s worlds, players averaged a score of 3.65 when throwing a draw on the first shot of the end. And the first shot of the end is a nice controlled experiment. Every time the shot is thrown, we know there are no rocks in play.
For the last shot of the end, players averaged 3.18 on their draws. This is useful knowledge, but using this number to describe the difficulty of a draw on a final shot is not good enough. Because the scoring is based on achieving the shot’s objective, there are a large range of possibilities for the difficulty of the final shot, from being able to touch paint for a score to needing to draw to the pin.
Fortunately, the shots listed earlier in the end can provide some help on difficulty. Basically, if you know how many hits were played in the first 15 shots, you can get a decent estimate on whether a draw will be easier or harder than average. And knowing how a player’s teammates did before their shot helps, too. A bunch of misses will tend to make that final shot more difficult. You can never get to the point where you know if a draw to the pin is needed, but you can get closer to the true difficulty.
It’s that approach that has led me to something I am calling “points over expected” for now. (I’m open to suggestions for a flashier name.) Basically, take the average difference between the points awarded and the expected points on each shot thrown. With this approach you can more fairly compare the contributions from players at different positions. You can more fairly compare how players are doing on certain shots or certain turns. The possibilities are endless.
Here’s the leaderboard for my yet-to-be-named stat based on all shots thrown at the women’s worlds through Monday:
    Switzerland +0.276 6-0
         Sweden +0.173 5-1
       Scotland +0.097 4-2
         Canada +0.087 2-5
          China +0.084 4-2
            RCF +0.082 6-0
          Japan +0.032 2-3
  United States +0.025 4-3
        Germany -0.040 3-4
        Denmark -0.095 2-4
          Korea -0.112 2-5
 Czech Republic -0.179 2-4
          Italy -0.205 1-6
        Estonia -0.239 1-5
With this data, we can have a more interesting conversation about what’s happened so far.
There are two unbeaten teams, but one of them has played much better than the other. Switzerland has been a machine so far. When we look at the individual player ratings by this method, the Swiss have been outstanding at each position. Melanie Barbezat has been far and away the best lead at the worlds and Esther Neuenschwander has been the best second. Silvana Tirinzoni has been the second-best third (Japan’s Onodera Kaho is the surprising leader there) and Alina Pätz has been the second-best fourth (to Eve Muirhead).
The Swiss will come back down to earth a bit. I mean, if they don’t, they probably won’t lose a game, and that doesn’t seem realistic. But it’s clear that Switzerland has been the best team so far.
The order of the unnamed stat lines up pretty well with the overall standings with the obvious exception of Canada. Whatever the issue is with Canada’s poor start, it’s not that they’ve played poorly. They haven’t played like the best team in the world, but they’ve played like a playoff team. Late-game rock luck hasn’t gone their way to a large extent. Exhibit A is Kovaleva’s second-to-last shot in the eighth end that propelled The Federation to a comeback win.
Can Canada recover to make the playoffs? On that question, it seems everyone is under the impression that Canada can’t lose again if they want to finish sixth, but I think it’s more likely than not that if Canada finishes 7-6, they are in the playoffs. For one thing, there are only six teams over .500 right now. And if Canada is winning games it means they are beating some of those teams trying to claw their way to 7 wins.
Also, I’ve been holding out hope for Korea – who at 2-5 has the same record as Canada – to make a run, as well. But based on expected points, the Koreans have played like the 11th-best team thus far. So their situation is quite a bit different from Canada. They don’t have much room for error and they have to play much better the rest of the way.
Much of Canada’s fate depends on the U.S. since Canada would lose a head-to-head tiebreaker to the Americans due to an earlier loss. The U.S. has already played Estonia and Italy and has not played the powerhouses of Switzerland, Sweden, or The Federation, which is just the opposite of Canada’s schedule. Canada will be favored in every game the rest of the way and while that’s a long way from saying they’ll win every game the rest of the way, they might not even need to do that to make the playoffs.
Postscript: I hope to publish shot-by-shot data with the expected points derived from my method for the men’s and women’s worlds (and other past events) in the near future. There are many more potential uses for it than just identifying which team is playing the best.
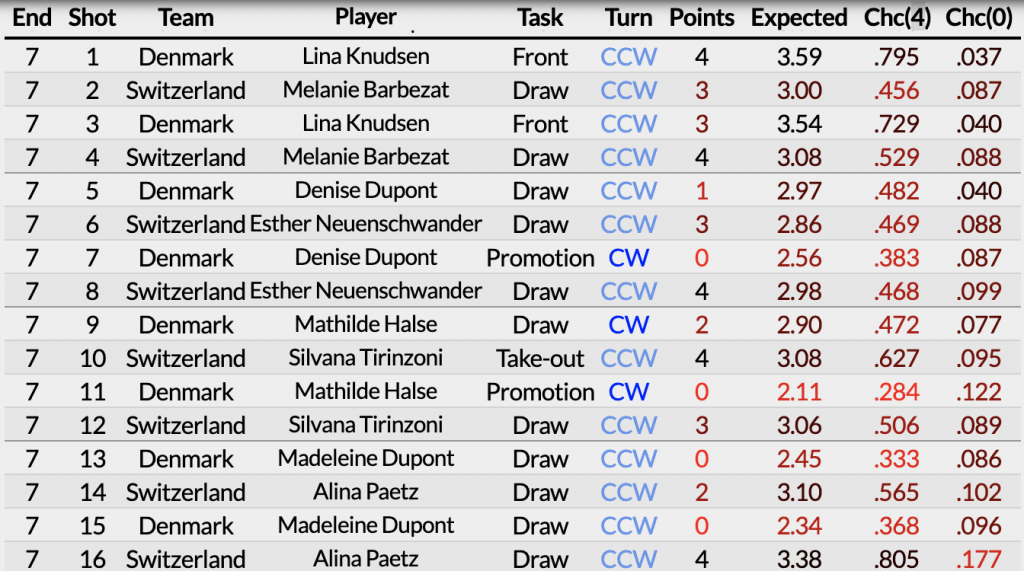
In the meantime, here’s what an 8-ender looks like. Notice Denmark’s shot difficulty falling into the abyss as they continue to miss late in the end, while Switzerland’s shots are somewhat easier as they continue to draw freely into the open rings.