Going into the 2020 Canadian women’s curling championship a.k.a. The Scotties, the odds of each team winning were:
Ontario: +151
Manitoba: +207
Wild Card: +290
Team Canada: +619
Alberta: +1000
Saskatchewan: +1000
British Columbia: +1300
Prince Edward Island: +2100
Northern Ontario: +3000
Nova Scotia: +4000
Northwest Territories: +4100
New Brunswick: +5800
Quebec: +7700
Newfoundland & Labrador: +11500
Nunavut: +17400
Yukon: +23300
This is from a sportsbook called Sports Interaction per a piece at onlinegambling.com.
The most interesting figure is Northern Ontario at +3000. I don’t know how these odds were generated, but I am picturing a low-paid employee without much interest in curling putting these together. (It’s possible other sites offered a less juicy price for Northern Ontario, but there’s no trace of this on the internet. And besides, these odds make for a better story.)
As it was in 2016, 2017, and 2019, Northern Ontario was represented by Krista McCarville’s team, whose track record suggested they were a legitimate darkhorse to win the event. In 2019, Team McCarville advanced to the four-team playoff with the second-best record in pool play. In 2017, they qualified for the playoffs by finishing pool play with the third-best record. And in 2016, the team finished pool play with the third-best record and lost in the finals to Chelsea Carey.
If our pimply-faced intern had any awareness at all, he wouldn’t have made Northern Ontario the ninth (!) choice on the board entering the Scotties. This time around, McCarville easily made it to the playoffs before losing to Rachel Homan in the 3 vs 4 game.
What could have led to such an odds-making mistake? In my forensic reconstruction, our rookie handicapper took a peek at the World Curling Tour rankings, saw that McCarville’s team ranked just 48th in the world and not coincidentally, ninth among teams to qualify for the Scotties.
To say the WCT rankings methodology is well-documented is an understatement. The full ratings description checks in at over 3000 words. I prefer a the explanation available from Curling Canada for the similarly-computed Canadian Team Ranking System. Only because it includes this passage from a section called ‘CTRS Challenges’.
CTRS registered teams or CTRS registered individual players may challenge the allocation of CTRS points to any team from a specific event no later than seven (7) full days after the completion of the event in question.
Challenges will be submitted by e-mail to Danny Lamoureux at danny@curling.ca within that time frame.
I can not imagine what poor Danny Lamoureux’s inbox looks like from week to week. Just so you know, ask all the questions you want and I will try to answer them. But no challenges will be accepted.
Despite the complexity, the WCT system gets the job done (though it is apparently changing for this season). Similar to the ratings used for the professional tennis and golf tours, it awards points for doing well in various events in order to determine which teams qualify for future events. The main way to game the system is to play a lot, since a team’s worst events get dropped. But if that’s the biggest flaw, it’s one we can live with. The best teams normally want to criss-cross the world playing a lot because they think curling is fun and they want to test themselves against the best.
However, this assumption breaks down in some cases. Krista McCarville prefers to raise a family and enjoys her day job so her team basically chills in Thunder Bay (or Sudbury in the case of one member) until it’s time to qualify for the Scotties. Then they proceed to give the top teams hell every year.
The WCT rankings use the eight best events for each team in a season. But on the eve of the Scotties, McCarville’s rink had played in just four. For the purpose of the rankings, it was like they showed up to four more events and did poorly.
The role of the WCT rankings is to tell us how good a team’s season has been from an accomplishment standpoint. They’re not designed to tell us about the ability of a team, and occasionally there’s a meaningful difference between the two concepts. In the case of Team McCarville, the difference was enormous. The yet-to-be-named ratings on this site are designed to bridge that gap. (McCarville was ranked tenth in my system before the Scotties, and the fourth best team to qualify for the event.)
Here’s what goes into the ratings:
That’s it. In some ways, curling provides us with a simple platform to launch a ratings system. There is rarely a need to consider home-site advantage and we can basically ignore scoring margin. (Scoring margin is not a great measure of dominance in a game between elite teams anyway.)
Because of the simplicity, these rankings are in the glorious stage of just being a few lines of code. But I know it won’t stay that way. Those WCT rankings didn’t require 3000 words at some point in the past. But enough teams bothered people like Danny Lamoureux or Gerry Geurts that little changes were added here and there. And over time, things got complicated.
My code will probably follow a similar development path. I will not always be able to resist including a measure of game dominance. That would actually solve a lot of problems in rating teams that play few games. But for now the rankings seem to be sensible enough. For those interested, I’ll now explain some of the model design choices.
There are two main options for a rating system using game outcomes only: Elo or Bradley-Terry. There are many other systems besides these two, but these are the most popular and represent distinct approaches. The choice on which to use largely depends on the answer to this question: Should a team’s rating to be influenced by results of its opponents?
In Elo, if Team A beats Team B, they get a certain reward in the ratings. That reward will never change going forward. In Bradley-Terry, Team A will get a bigger boost from that game in future weeks if Team B does well going forward. Or likewise Team A will get less of a reward if Team B does poorly going forward.
Another way to think of it is that Elo assumes that a team’s rating prior to one of its games is frozen forever. This causes problems, especially when we don’t have much information to base a team’s rating on. In that case, we have to assume a rating for a new team. And given how often new teams are formed in the sport, this issue comes up frequently at the beginning of each season.
On the other hand, Bradley-Terry assumes that a team’s current rating is the best estimate of the team throughout the entire ratings period. A win from three months ago over an opponent is evaluated using that opponent’s current rating, which obviously could have changed since the game was played.
Another issue is that Elo tends to overrate “playing”. A team that goes 20-10 will be rated better than a team that goes 10-5 against similar competition. This isn’t bad in itself, but we need a system that can best handle that vast differences in games played by curling teams. (And also the differences in opponent quality.) So in experimenting with both systems, Bradley-Terry was the clear choice for our purposes.
The actual rating from the system is not terribly meaningful to humans. It’s just the way to sort the teams. A ratings difference of X doesn’t mean a team should be favored by X. But the rating is a way to determine one team’s chance of beating another. You can tap on a team’s rating and see its chance of beating every other team. (For now, click on the ratings header to reset the table.)
You can also click on a flag to filter the ratings by that country.
For the first effort, a team is defined by their skip. This is something that simplifies my code, but will eventually be changed to the WCT standard of maintaining three common players. In the meantime, this approach leads to one glaring oddity in the ratings that many people have noticed and will be the subject of a future post.
One other design consideration was how far back to include data. While Bradley-Terry can make probabilistic predictions, it’s not specifically designed to be a predictive model. To overcome this, I have given more weight to more recent events. In addition, games going back two calendar years are included. (That being said, all records on the ratings page are from the current season.)
That sounds like a long time, but this provides the ratings with some useful stability. Stability is generally a feature but it’s not always positive. Teams on the decline will tend to be propped up a bit and teams on the rise will be held back. But more often than not, giving a little bit of weight to last season’s results improves the system. Since we want to use this to make predictions, stability will normally be our friend. We need to be careful about overreacting to one or two outlier events.
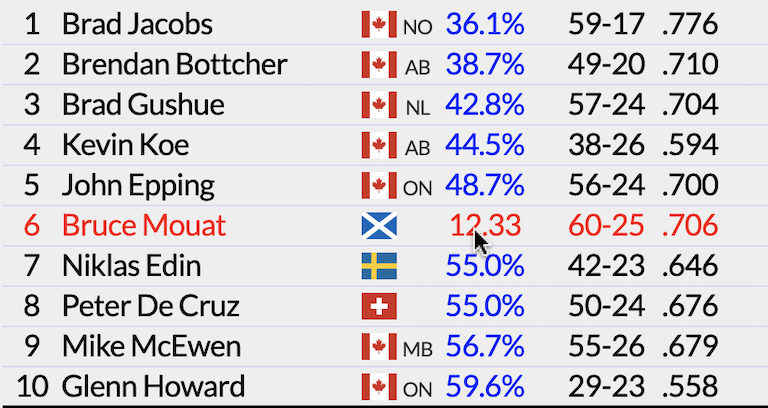
This happened last season when John Epping jumped from fifth to second in the WCT rankings after winning two early bonspiels. Top curlers like Ben Hebert and Brad Gushue thought passing Brendan Bottcher for second was too big of a jump. In the DoubleTakeout.com ratings, Epping jumped from ninth to seventh which might be seen as too small of a reward.
Regardless, we aren’t here to gain the approval of Ben Hebert or Brad Gushue. (To be clear, we aren’t going to turn down their endorsement of DoubleTakeout.com, either.) Our system is loyal to making better predictions and any changes made going forward will be to serve that purpose.
If that means that a team’s rating doesn’t improve much after winning the Shorty Jenkins Classic then so be it. You get evaluated on the quality of your opponents and how often you beat them. And if you want to be number one, it’s going to take a long run of sustained success against top opponents to get there.