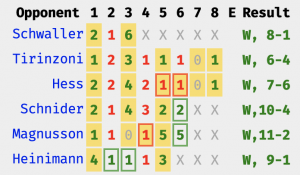
On the forecast pages, there are now links to players scores in that event. This what Peter De Cruz’s page looks like for last week’s event, the Adelboden International, which he won:

This presentation is a little different, but it’s offered in the spirit of conciseness, if there is such a thing. You don’t need two rows for the scoring summary since only one team can score in each end. So that’s how we’re presenting scores for now. Green numbers are scores for the good guys, red for the bad guys, yellow indicates the good guys have hammer, and boxes are for steals. Boom. (Apologies to my color-blind friends.)
We can see that Team De Cruz scored four or more with hammer in five different ends during the event, which was also the number of times they were forced. Without hammer, they never faced a situation where they were tied or trailing. They got pushed by Tirinzoni and to a lesser degree, Hess, but in both cases they played the last end with hammer either tied or leading. Team De Cruz’s opponents conceded a quarter of the scheduled ends over their six games. Any way you slice it, it was an impressive run.
Two weeks ago, I introduced a measure for dominance. Shortly thereafter, I discovered it was not the miracle cure for determining how well a team played in an event. It works well in most cases, but if a team makes a big comeback, it can look dominant by that measure.
Maybe it is best to keep it simple and just look at team’s average win probability during an event. Here’s how the top eight looked for Adelboden:
      Team  AvgWP Result
   De Cruz   81.2    1
  Retornaz   68.2   SF
  van Dorp   60.2   QF
    Totzek   59.5   QF
    Hoesli   59.1   QF
 Tirinzoni   54.7   SF
      Hess   50.2   QF
 Schwaller   49.6    2
I don’t know that’s there much to read into this other than De Cruz was easily the best team last weekend. Schwaller had to pull out a couple of games in the 8th end to get to the final where he had the 3rd-end concession and that’s going to hurt in this measure.
It’s a little more interesting to look at average win probability by end and I have something cooking on that. For now, I’ll point out that De Cruz’s average win probability heading into the 8th end was 93% which is not surprising considering that four of his opponents had conceded by then. But entering the 4th end it was 88% which is surely rare territory for any event.
While we’re on the topic of win probability by end – if you could only watch one end of a curling game, what would it be? You might say the 8th end, of course, but while the 8th end has the most potential for drama, you could also be staring at an empty sheet of ice, as one would have been for the Adelboden final.
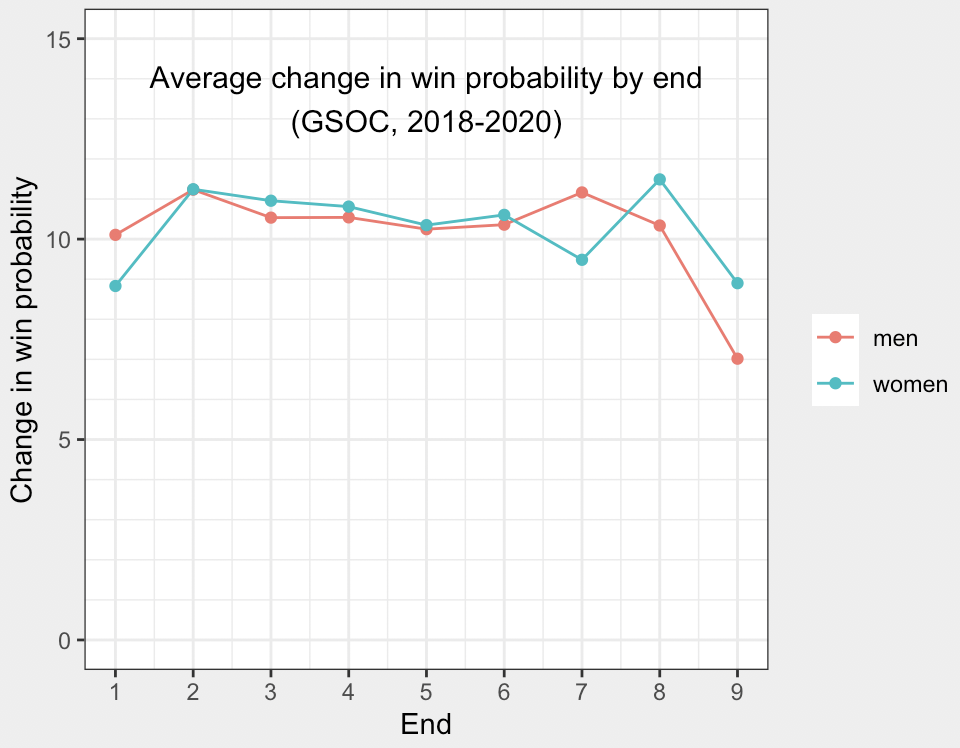
This is not a straightforward question to answer analytically. One way to look at this is to figure out the average change in win probability in each end for a bunch of games. Here’s the average change in win probability in each end over the past three seasons of grand slam events:

On the women’s side, the 8th end has seen the biggest change in win probability, while on the men’s side, the second end barely beats out the second end. But besides the first end and the ninth (extra) end, they’re all pretty close. Which I think is what you want, after all. We shouldn’t really be able to guess when the game will be decided before it starts.
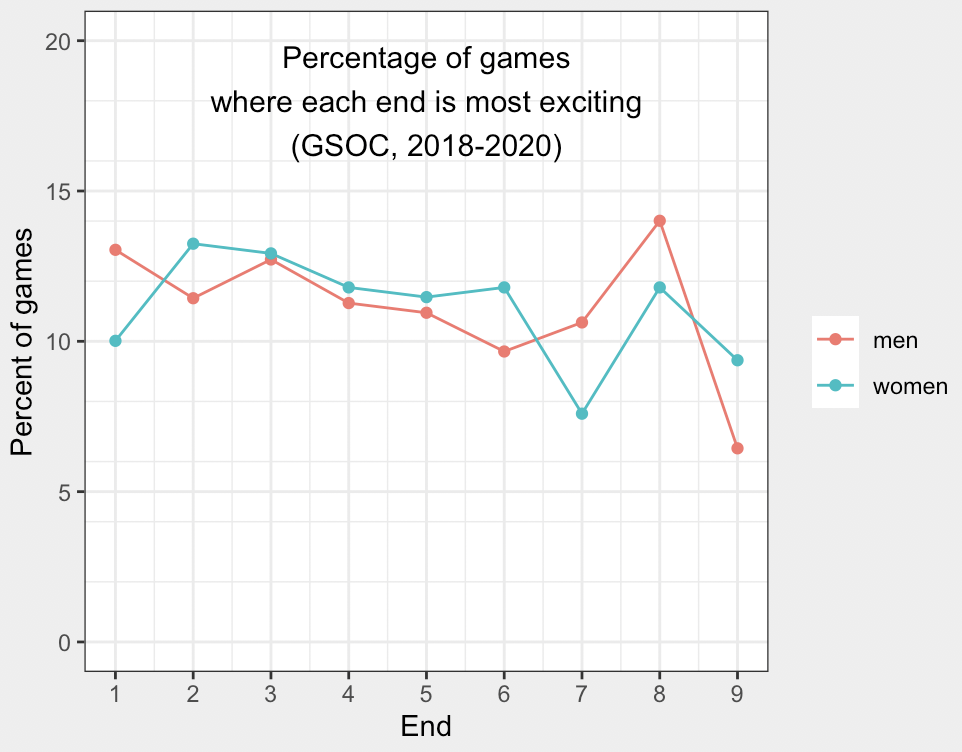
Another way to figure this out is to look at how often each end is the end that affects the win probability most in each game.

By this approach, the eighth end is the most exciting in the men’s game (followed by the first), while the second and third ends take the cake on the women’s side. But again, most ends are fairly close.
However, what if you are risk averse?
Then you have to go with the 2nd end. In just 1.6% of women’s games and 4.2% of men’s games it was the end that changed win probability the least. Something interesting should happen in the second. On the flip side, it shouldn’t be surprising that the 8th end is most often the least-exciting end, and by a mile. It is the least important end in just over half of all games for both the men’s and women’s slams. Nobody wants to stare at an empty sheet.