Last week, Team Mouat stunningly failed to make the playoffs of the Champions Cup. Bruce is still king of the world ratings and really, the team’s 1-4 performance wasn’t Bruce’s fault. Because I’m cheap, I didn’t see any of the event except for the Friday night draw provided free of charge by Sportsnet so I can only go by the number. But the shot data shows that while Bruce didn’t play great, he played well enough to deserve better, ranking as the third-best fourth in the event.
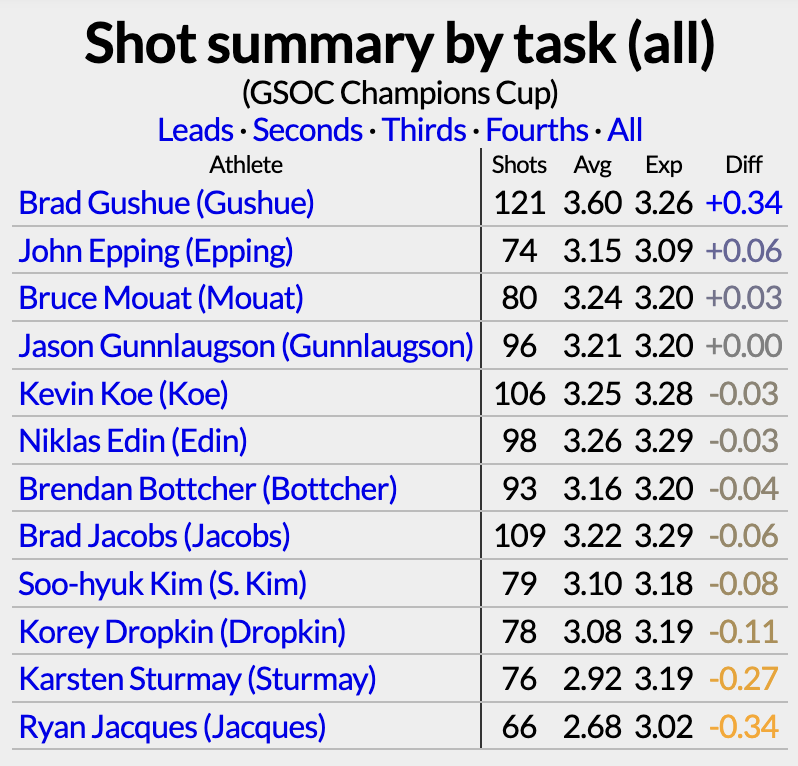
(Brad Gushue completely owned this event, by the way, curling 90%.)
However, Mouat struggled on draws, ranking third-worst among the last throwers. This included an extra-end miss on his last shot against Jason Gunnlaugson. Despite the extra-end loss with hammer, it’s good to see Bruce still supports the no-tick rule.
But I am actually not here to break down King Bruce’s week. I’m more interested in the fact that my sims gave the team a 95% chance to make the playoff round.
On the one hand, it looks bad when a 95% prediction fails to come true. On the other hand, 95% means that the prediction will fail to come true 1 in every 20 times. Now that the season is over*, I have enough forecasts to evaluate whether the probabilities are unbiased.
*The season really should never be over in my opinion, and besides, the world juniors start this weekend. (Canada, Norway, and Scotland are the favorites on both sides of the draw there.) Also, Covid isn’t going away and we might as well start moving the schedule back a couple of weeks to account for the inevitable January cancellations.
Overall, I ran forecasts for 25 events this season. There were 16 cases where a team was given at least a 90% chance to make the playoffs and Team Mouat was the only case where a team missed. So 94% of the time, a team made the playoffs and in those 16 cases that average forecast was 94%. There’s really no cause for alarm from this week. But we can look at each probability range to get an idea of how well the forecasts are calibrated.
Range  cases pred  obs
90-100% 16    94%  94%
80-90   28    84   89
70-80   28    75   93
60-70   25    64   60
50-60   28    54   57
40-50   33    45   36
30-40   26    35   23
20-30   46    25   30
10-20   37    15   11
 0-10   49     4    0
Not bad. You can see that teams that were given a 70-80% chance of making the playoffs actually made it 93% of the time. But overall, there’s not an obvious bias and with more events, I suspect that anomaly would shrink.
By the way, the award for least likely playoff qualifier this season was Jason Camm (11.1%) at the Ontario Tankard.
Here’s what the data looks like for title predictions:
Range  cases pred  obs
40-100%  8    50%  50%
30-40   12    34   33
20-30   25    24   20
10-20   35    14   20
 5-10   49     7    6
 0- 5  181     1    1
There’s nothing to quibble about here. In related news, the least likely champion this season was Mary-Anne Arsenault (3.7%) at the BC Scotties.
Any predictive ratings system is going to be primarily based on the participants recent performance. But how to regress that past performance is the challenge. In aggregate, it appears the ratings do a good job of that as presently constructed. That’s not to say there aren’t misses with individual teams, but overall the probabilities are pretty reasonable. King Bruce missing the playoffs really was a fluke that we should expect to see rarely, but not never.